
Olympic basketball is undergoing a permanent transformation. Advanced analytics—once reserved for NBA front offices—now dictate how national teams prepare, strategize, and win on the world’s biggest stage. From lineup efficiency to shot-quality models, data has become the hidden engine behind modern Olympic success, reshaping everything from coaching decisions to late-game execution forever.
Why Americans Are Asking: Is Olympic Basketball Now a Data-Driven Game?
Over the past decade, American fans have noticed something different when watching Olympic basketball. Rotations feel unconventional. Superstars sometimes sit during crucial stretches. Mid-range jumpers are disappearing. Defensive switching looks relentless and almost mechanical.
These aren’t coincidences.
They are the visible fingerprints of analytics—quietly redefining how Olympic basketball is played, coached, and won.
As the global talent gap narrowed, instinct alone stopped being enough. In a format where a single loss can end a gold-medal dream, teams turned to data not as a luxury, but as a necessity.
The Old Olympic Basketball Era vs the New One
For much of Olympic history, basketball success relied on three pillars:
- Raw talent
- Isolation scoring
- Coaching intuition
This approach worked when Team USA’s athletic advantage was overwhelming. But international basketball evolved. Countries invested in development pipelines, embraced NBA-style training, and produced stars capable of competing at the highest level.
As games tightened, margins shrank.
Analytics emerged as the difference-maker.
Today’s Olympic basketball emphasizes:
- Efficiency over flash
- Process over reputation
- Matchups over hierarchy
This shift has permanently altered the sport.
What “Analytics” Really Means in Olympic Basketball
Analytics isn’t about removing humanity from the game. It’s about improving decision-making under pressure.
In Olympic basketball, analytics typically include:
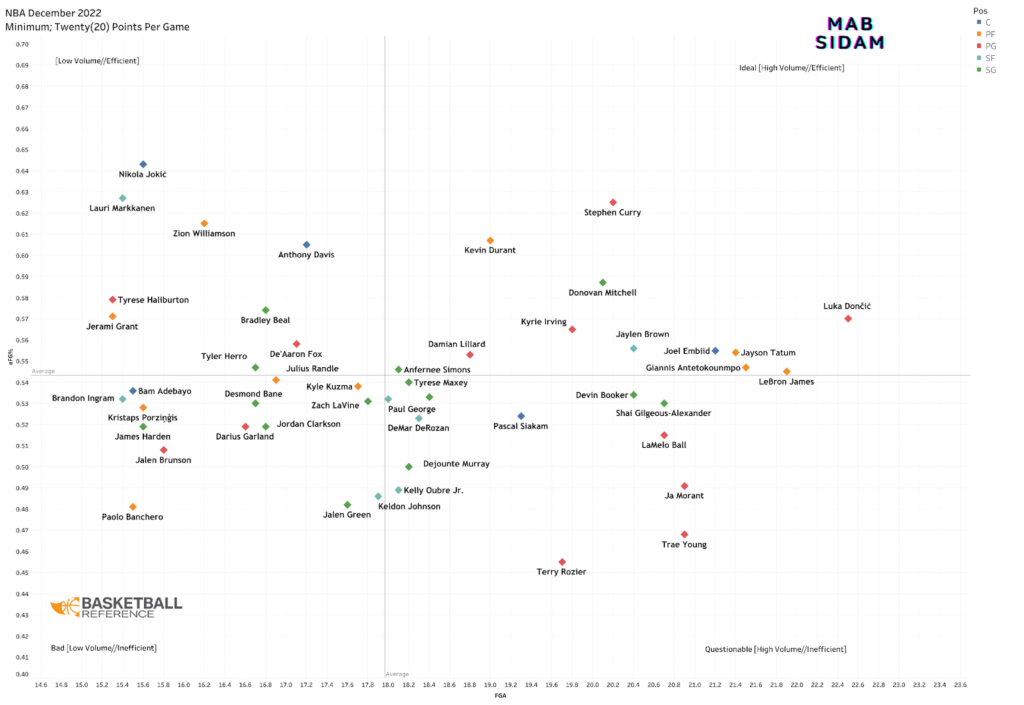
- Shot-quality modeling (expected points per attempt)
- Lineup net ratings
- Defensive matchup efficiency
- Transition scoring data
- Turnover probability tracking
- Fatigue and minute-load analysis
Every medal contender uses these tools—often invisibly, but relentlessly.
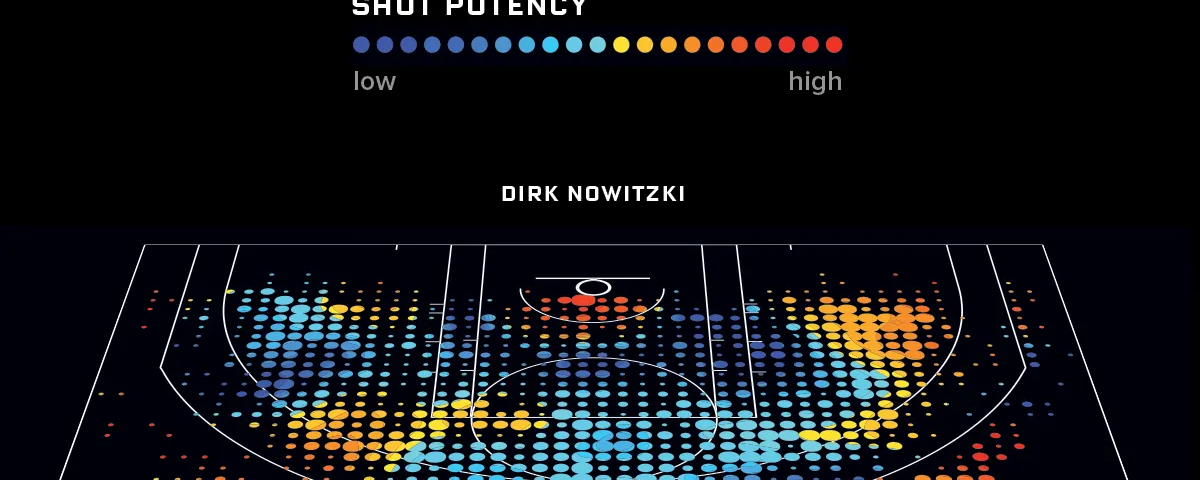
The Shot Selection Revolution: Why the Mid-Range Is Fading
One of the most obvious analytics-driven changes is shot selection.
Decades of data from NBA and FIBA competition reveal a clear pattern:
- Shots at the rim and open three-pointers produce the highest efficiency
- Contested mid-range shots consistently underperform
Olympic teams now reflect this reality.
What Analytics Changed About Offense (Pointers)
- Fewer isolation pull-ups
- Increased drive-and-kick sequences
- Greater emphasis on spacing
- Rim pressure prioritized on every possession
To traditionalists, this can feel repetitive. To coaches, it’s mathematical survival.
Team USA as the Blueprint for Analytics-Driven Evolution
The USA Men’s National Basketball Team provides the clearest example of analytics reshaping Olympic basketball.
Earlier versions of Team USA relied on dominance. Modern versions rely on efficiency.
Recent Olympic squads:
- Close games with statistically optimal lineups
- Adjust rotations based on net ratings rather than star status
- Tailor defensive schemes to opponent shot profiles
This evolution explains why Team USA continues to win even as games appear closer than ever.
Defense Goes Data-Driven: Why Switching Took Over
Analytics revolutionized defense just as much as offense.
Data showed that:
- Switching reduces high-value scoring opportunities
- Forcing isolation lowers offensive efficiency
- Rim deterrence matters as much as shot blocks
As a result, Olympic teams now:
- Switch more aggressively
- Protect the paint above all else
- Concede low-efficiency jumpers by design
This explains why Olympic basketball feels more physical, slower, and tactically intense.
Lineup Analytics: Why Coaches Trust the Numbers Over Names
One of the most controversial outcomes of analytics is late-game lineup selection.
Fans often ask:
“Why is a star player sitting right now?”
Analytics answer with cold clarity:
Because another lineup performs better per 100 possessions.
Lineup analytics measure:
- Net efficiency
- Defensive versatility
- Spacing compatibility
- Turnover avoidance
In Olympic basketball, medals don’t reward sentiment—they reward results.
How Analytics Help International Teams Compete With Powerhouses
Analytics didn’t just benefit Team USA. They empowered challengers.
Teams like:
- France men’s national basketball team
- Serbia men’s national basketball team
- Spain men’s national basketball team
Use analytics to:
- Slow the pace
- Maximize half-court efficiency
- Target mismatches precisely
- Reduce turnover risk
Data allows these teams to compete smarter, not just harder.
The Possession War: Analytics’ Most Important Battlefield
In Olympic basketball, possessions are priceless.
Analytics emphasize:
- Turnover margin
- Offensive rebounding efficiency
- Transition conversion rates
Why? Because one extra possession in a 40-minute game can decide gold.
Possession-Focused Analytics (Pointers)
- Pressuring ball handlers with high turnover probability
- Selective offensive rebounding to avoid fast breaks
- Identifying optimal transition opportunities
This chess-match approach defines modern Olympic basketball.
Player-Tracking Technology Enters the Olympics
With advances in tracking technology, Olympic teams now monitor:
- Sprint speed
- Defensive recovery time
- Fatigue accumulation
- Workload thresholds
This data shapes:
- Substitution timing
- Defensive assignments
- Practice intensity
Analytics don’t just optimize performance—they protect player health.
Why Analytics Matter Even More in the Olympics Than the NBA
Ironically, analytics have a greater impact in Olympic basketball than in the NBA.
Why?
- Fewer games
- No playoff series
- No margin for recovery
One inefficient stretch can end a campaign.
Analytics reduce randomness and increase predictability in high-stakes environments.
Coaching Has Quietly Become a Data Profession
Modern Olympic coaches are no longer just motivators. They are interpreters of data.
They rely on:
- Shot-zone heat maps
- Lineup efficiency dashboards
- Opponent tendency reports
Instinct still matters—but analytics shape those instincts.
Debunking the Myth: “Analytics Kill Creativity”
A common criticism is that analytics make basketball robotic.
Reality tells a different story.
Analytics don’t eliminate creativity—they channel it toward higher-value outcomes. Great players still improvise, but they do so in spaces proven to produce results.
Late-Game Decisions: Where Analytics Matter Most
Crunch time is where analytics prove their worth.
Data informs:
- Who takes the final shot
- Whether to foul or switch
- Which defender closes out
These moments are no longer gut calls—they’re evidence-based choices.
The Future of Olympic Basketball Is Data-Driven
As technology evolves, analytics will only grow more influential.
Expect:
- AI-assisted scouting
- Real-time efficiency adjustments
- Personalized player optimization models
Olympic basketball will never return to intuition-only decision-making.
The change is permanent.
What This Means for Fans
If Olympic basketball feels different—it is.
The game is smarter, more efficient, and more strategic than ever. Understanding analytics doesn’t diminish the spectacle; it reveals why the best teams still rise when it matters most.
Key Takeaways
- Analytics now shape Olympic basketball strategy
- Shot selection, defense, and rotations are data-driven
- Team USA embraced analytics to sustain dominance
- International teams use data to close talent gaps
- The analytics era is irreversible
Frequently Asked Questions (FAQ)
1. What role do analytics play in Olympic basketball?
Ans. Analytics guide shot selection, lineups, defensive schemes, and late-game decisions.
2. Do all Olympic teams use analytics now?
Ans. Most medal contenders rely heavily on analytics, though resources vary by country.
3. Are analytics more important in the Olympics than the NBA?
Ans. Yes, because single-elimination games magnify every decision.
4. Do analytics reduce player creativity?
Ans. No. They optimize where creativity is most effective.
5. Why are mid-range shots discouraged?
Ans. Data shows they generate fewer points per attempt than rim shots or open threes.
6. How do analytics influence defense?
Ans. They promote switching, paint protection, and forcing inefficient shots.
7. Can analytics help underdog teams compete?
Ans. Absolutely. Efficiency can offset talent gaps.
8. What is lineup efficiency?
Ans. A metric measuring how well specific player combinations perform together.
9. Do coaches still rely on intuition?
Ans. Yes—but analytics inform and refine those instincts.
10. Are analytics here to stay in Olympic basketball?
Ans. Yes. Analytics are now foundational to international competition.